Changelog
Follow up on the latest improvements and updates.
RSS
DTC Businesses don’t have time to wait for their books to be reconciled to make critical decisions around cash flow, inventory, invoices, scaling ad spend & more. I’m willing to bet you’ve spent more than one sleepless night…
- Wrangling financial data from dozens of sources
- Trying (and failing) to understand your cash flow in real-time
- Crunching some wild excel formulas (*=(B2/(day($AB$1))30))
- Worrying what your next P&L statement is going to look like (an anxiety compounded by the fact you won’t have answers for weeks)
… and thought to yourself, “when is someone going to build a finance tool for DTC brands?” You know, for the people like you. The people who need to make decisions about every dime on a dime.
We’ve had bouts of finsomnia, too. And we’re done with them.
That’s what inspired us to build FinHub, the newest feature brought to you by the hard-working, well-rested product team at Triple Whale. FinHub (Finance 💰 + Whale🐋 = FinHub 🤝) helps you make critical financial decisions in REAL-TIME.
*
currently only for our customers in the US & Canada
Read the full-release here: https://www.triplewhale.com/blog/introducing-finhub
We’ve overhauled the Pixel page, rolling out a new look, better tools, and faster load times, giving you smarter insights to maximize the profitability and growth of your business.
Read the full-release here: https://www.triplewhale.com/blog/new-pixel-page
Share Your Creative Report Card in Creative Cockpit
Is your Creative Director constantly asking about Creative Performance? Maybe it’s your (micromanaging ;) CEO or CMO asking what Creative is working? Introducing Report Cards for Creative Cockpit! The best part, no Triple Whale login required!
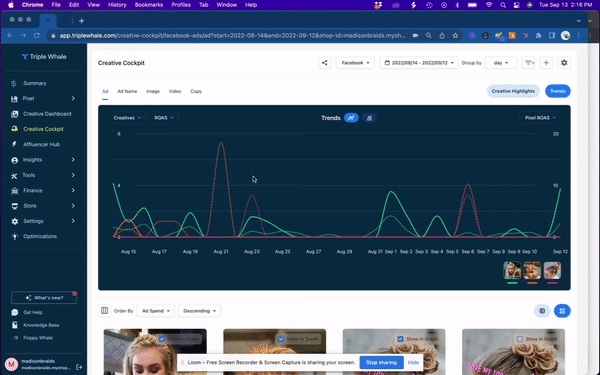
How it works
Step 1: Go to Creative Cockpit
Step 2: Apply desired segments or creatives
Step 3: Choose dates
Step 4: Select metrics in the chart, sort results, etc. Step 5: Click the Share button
Step 6: A share dialog will pop up; click on the Copy button and send it away!
Links can be opened by both logged-in and logged-out users. All controls that require requesting additional data are disabled—Facebook/TikTok selector, date range, creative grouping (Ad/Image/Video/Copy), sorting, etc.; however, the viewer can choose which metrics are plotted on the chart and switch between the Table and Card views.
Your influencers (and applicable affiliates) can now upload content themselves. No more cloud storage links, DMs, and other headaches! Create a link and send it to the influencer - they can upload all their content without having to create a login.
Step 1: Open up Affluencer Hub
Step 2: Click on an Influencer
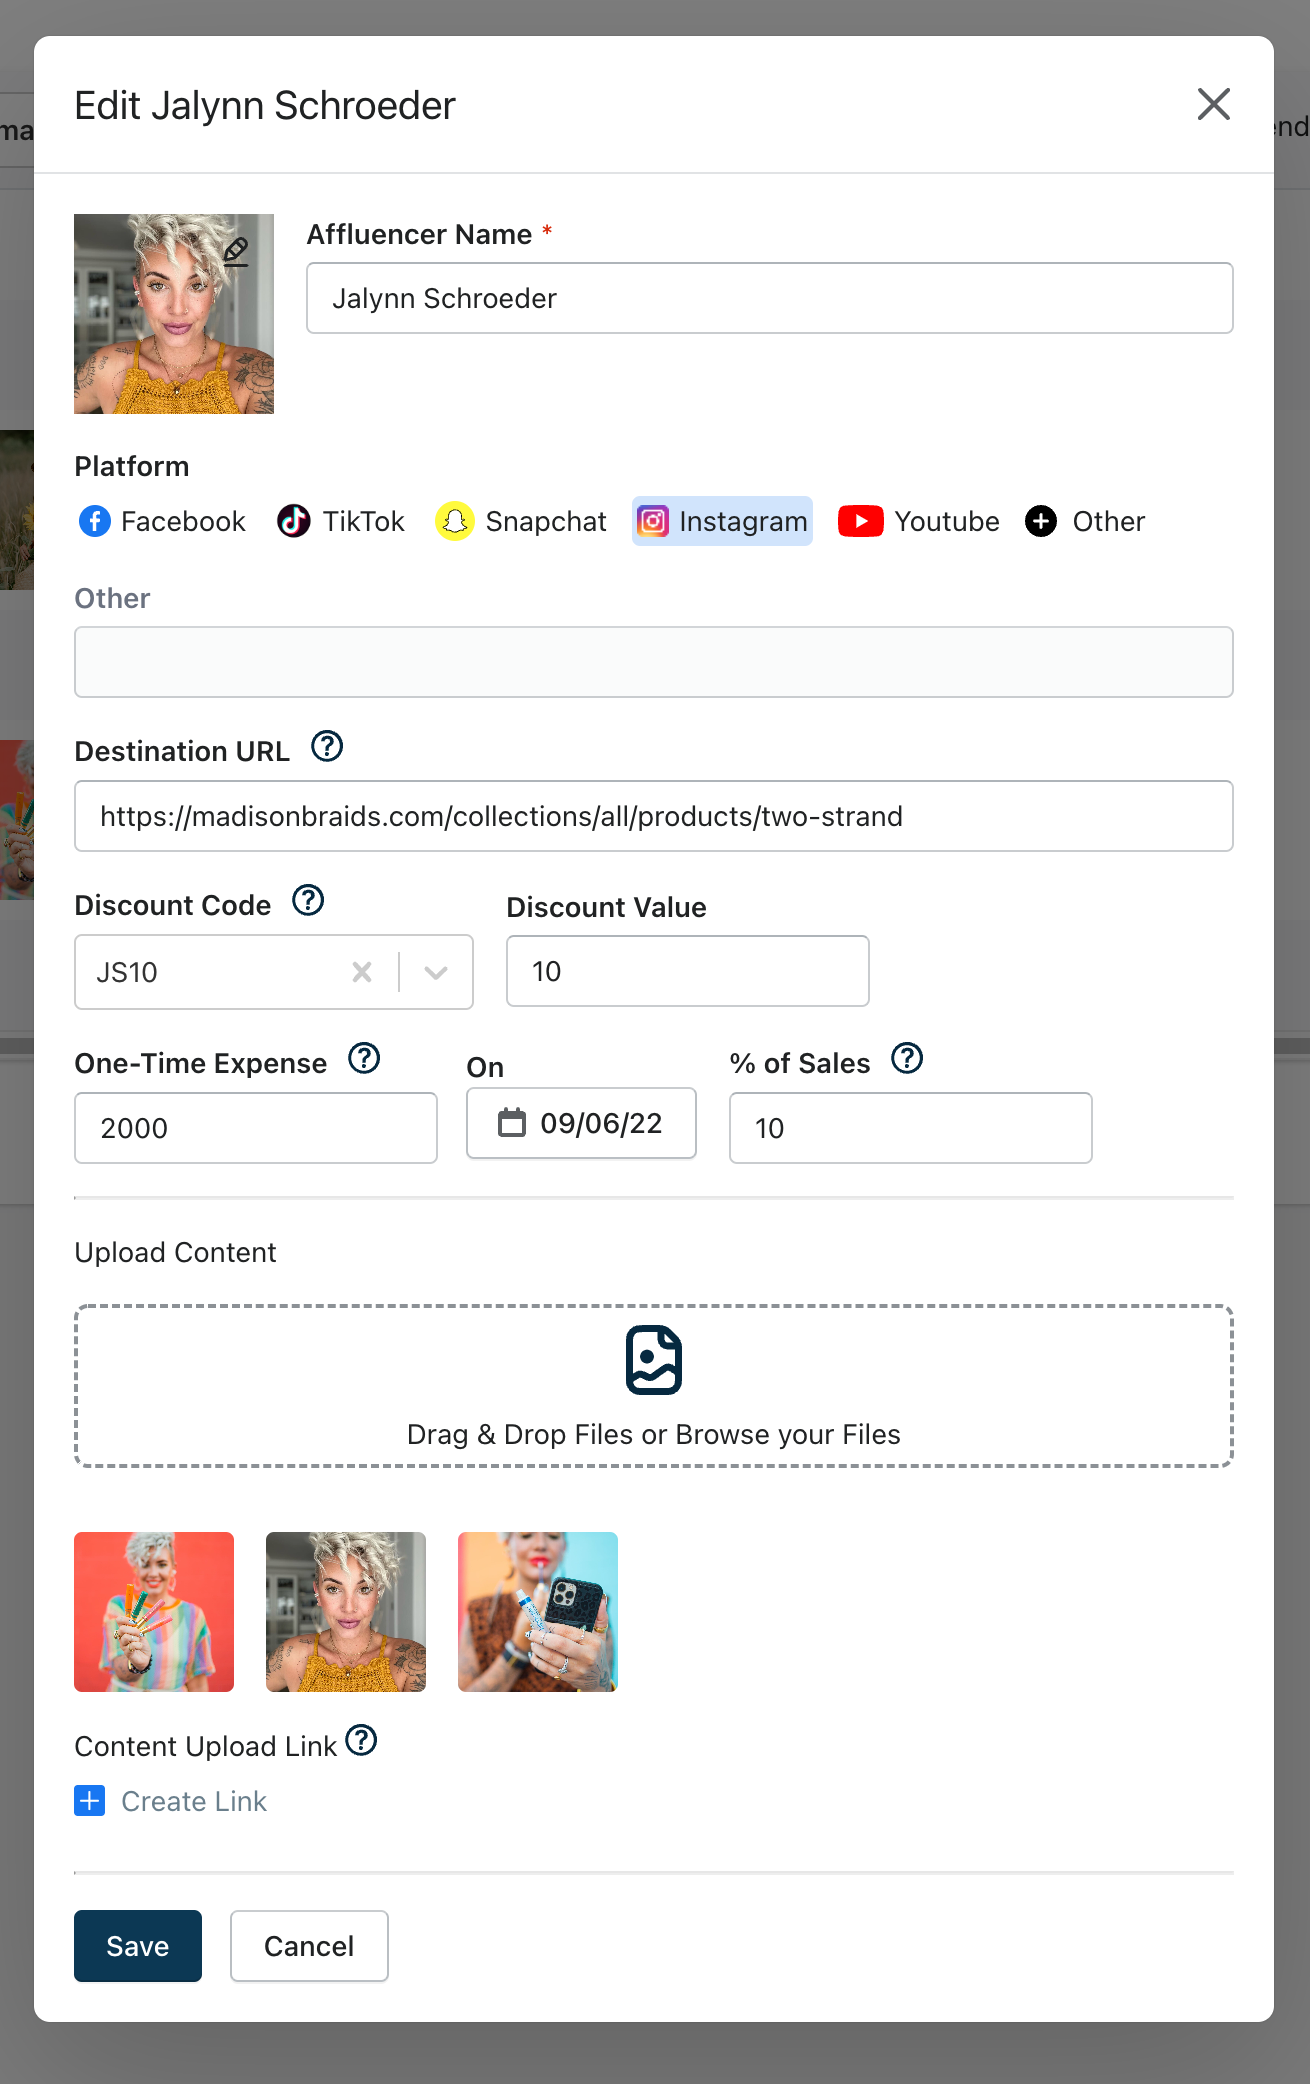
Step 3: Create An Upload Link
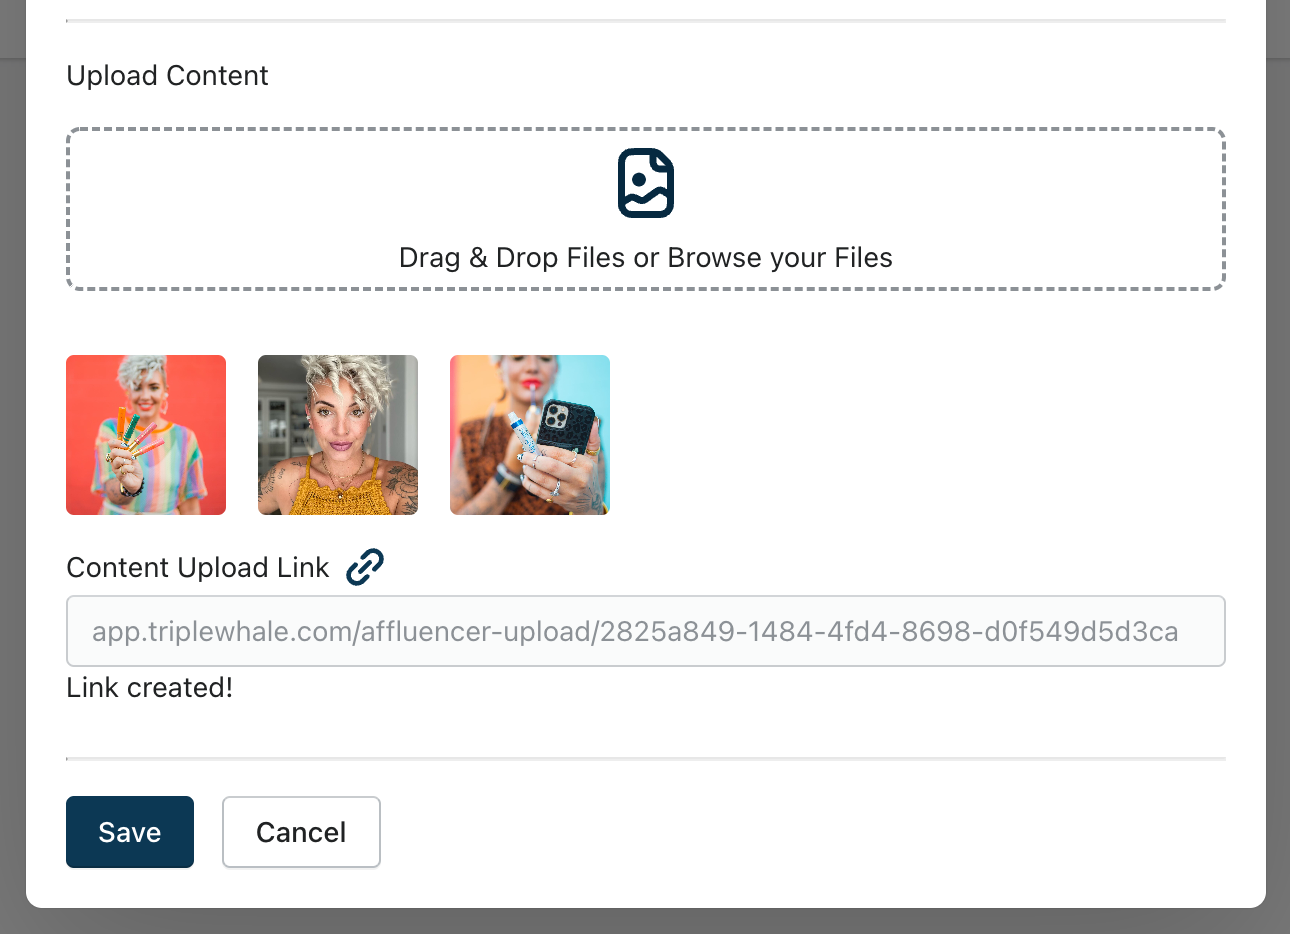
As a reminder, Affluencer Hub is free for life by adding it in September! Click on Affluencer Hub or here to upgrade today.
Introducing Zero-Party Data With Triple Whale's New Post-Purchase Survey
There is no silver bullet to attribution telling the perfect story, hence why we offer 5 attribution windows (First Click, Last Click, Linear, Triple Attribution, Triple Attribution + Views). The Post-Purchase Survey adds another great data point to better understand the customer journey and what touch point stuck out the most to customers.
Triple Whale's new Post-Purchase Survey gives you zero-party data; zero-party data is a fancy way of saying, customers are telling brands what the biggest influence to their purchase was. We can't wait for Triple Whalers to add zero party data to their attribution story, and visually see it in every customer journey when provided.
Read the full release here or get started today!
In the last 365 days we've tracked:
💰 $12 Billion in Gross Merchant Volume
📊 $2.23 Billion in Ad Spend
🛍️ 140 Million Orders
🌍 In 50+ Countries
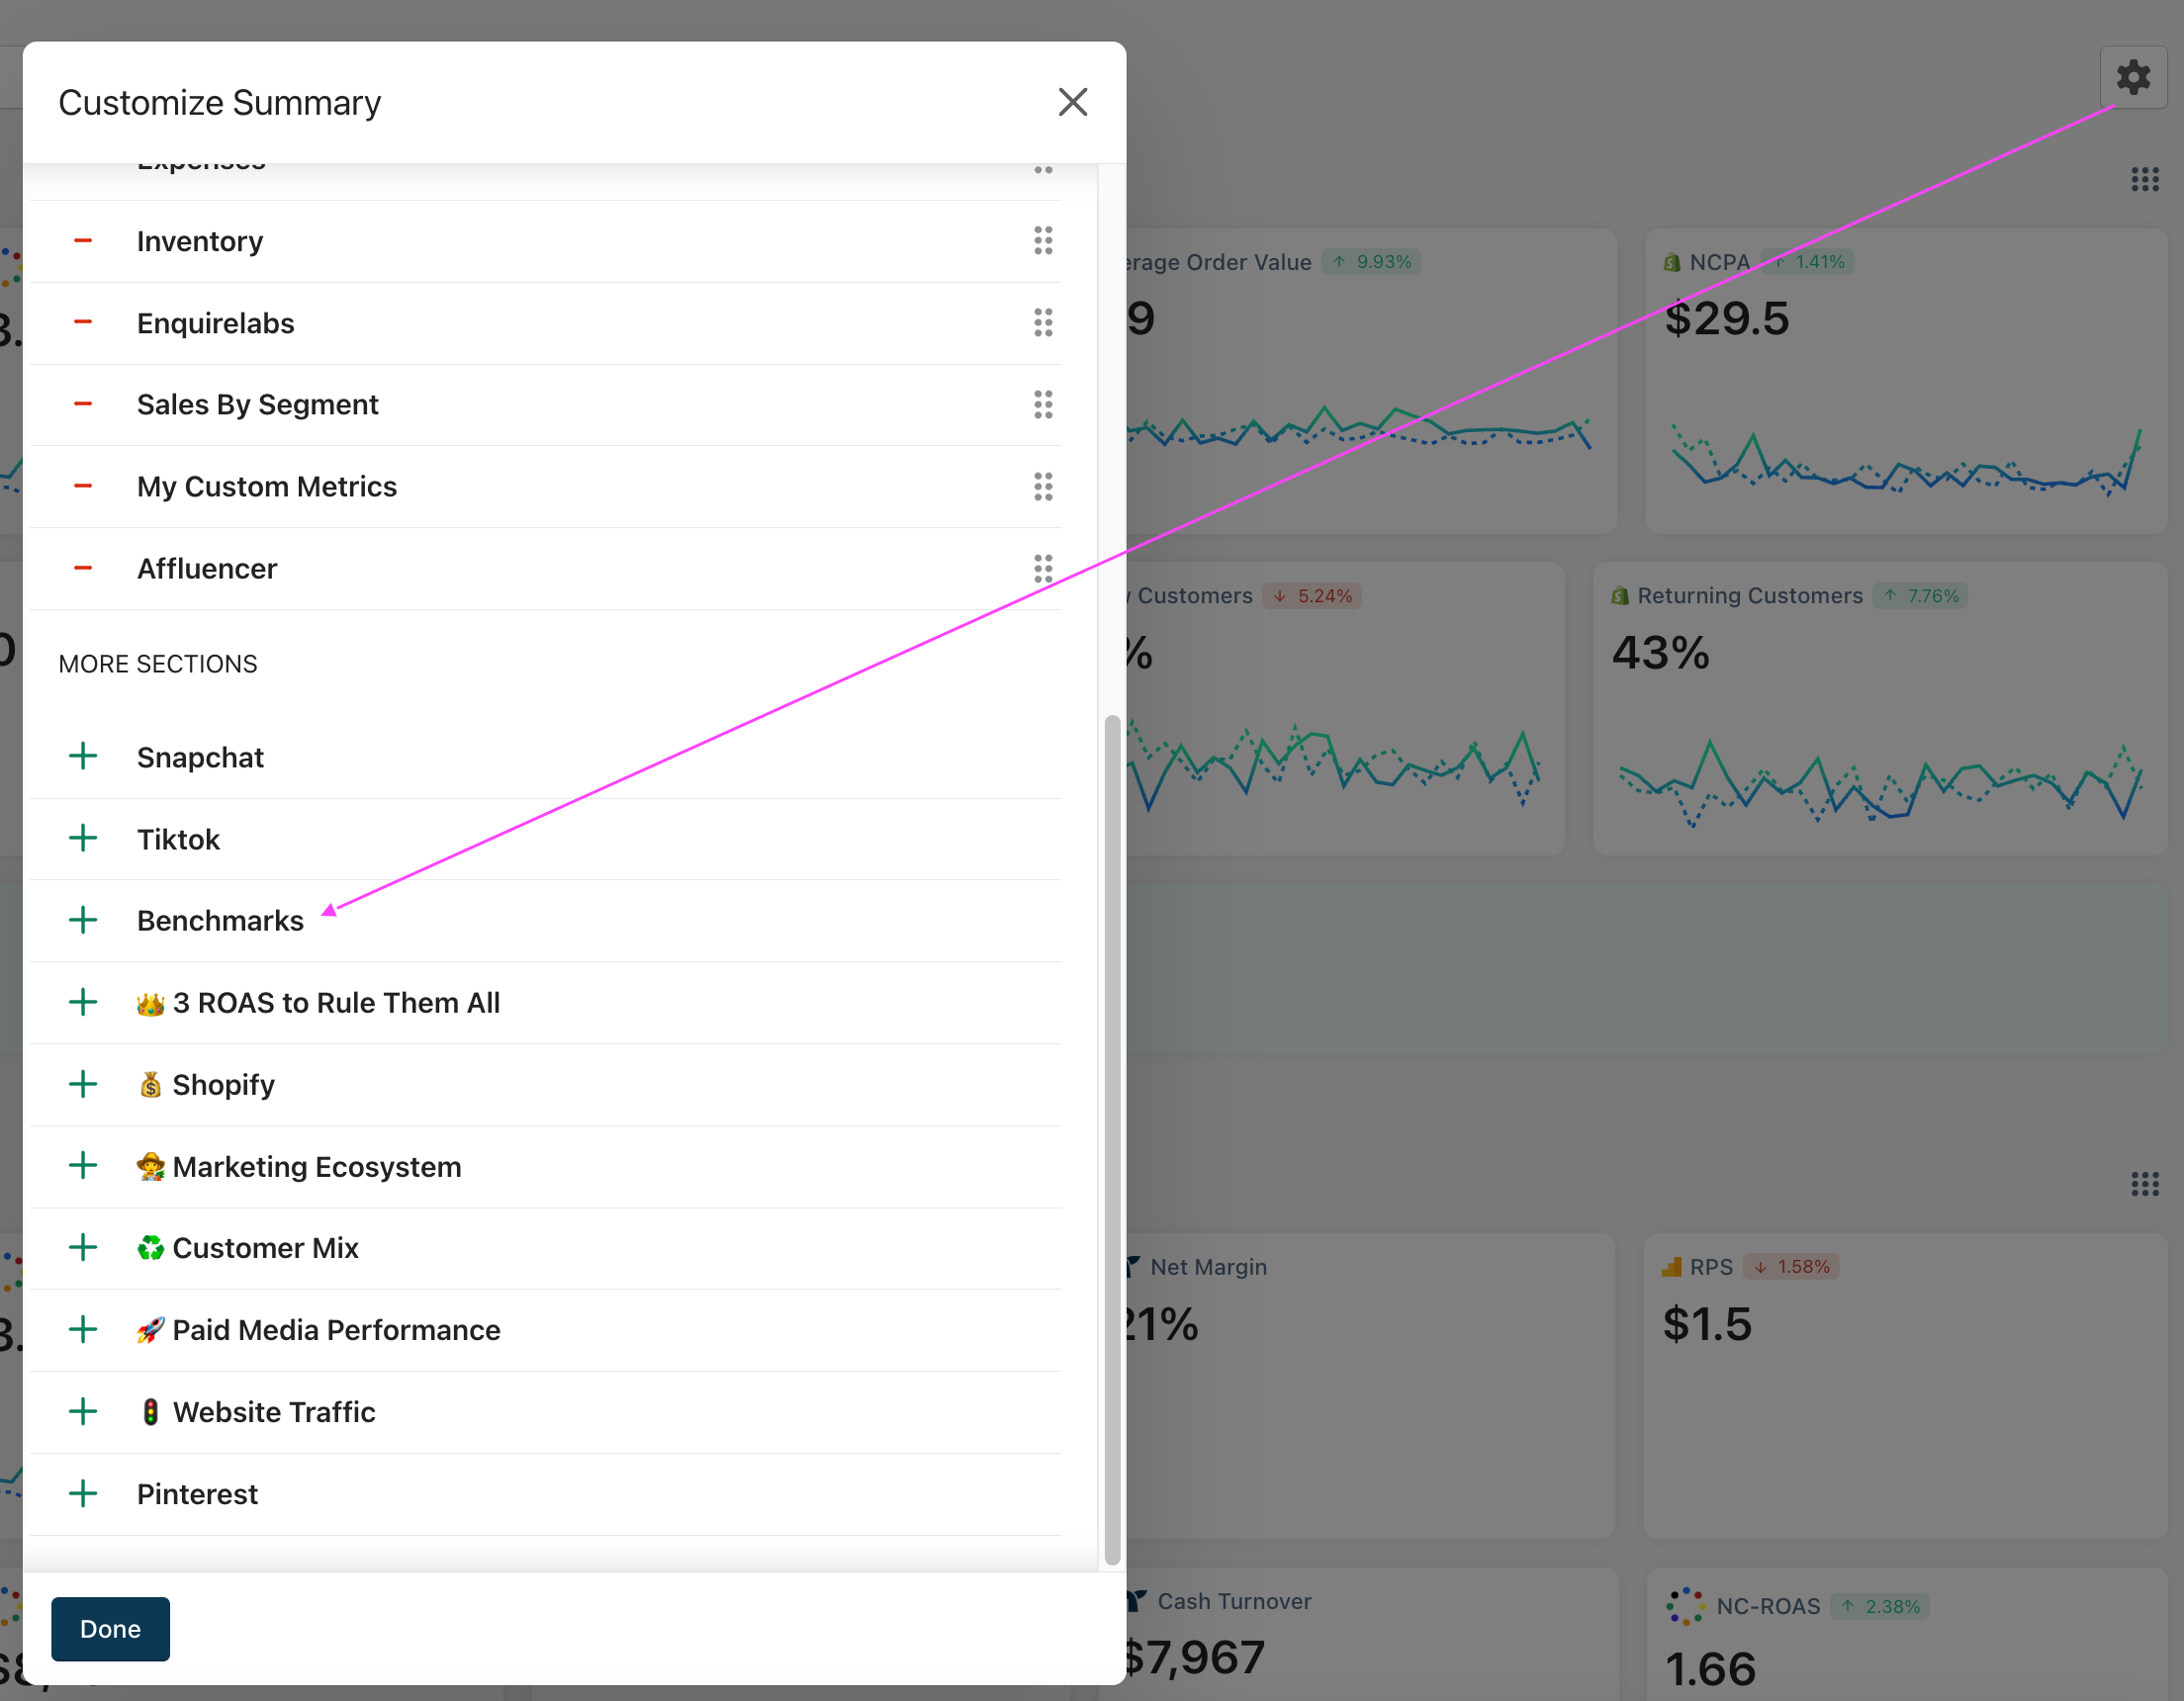
Access Triple Whale Benchmarks
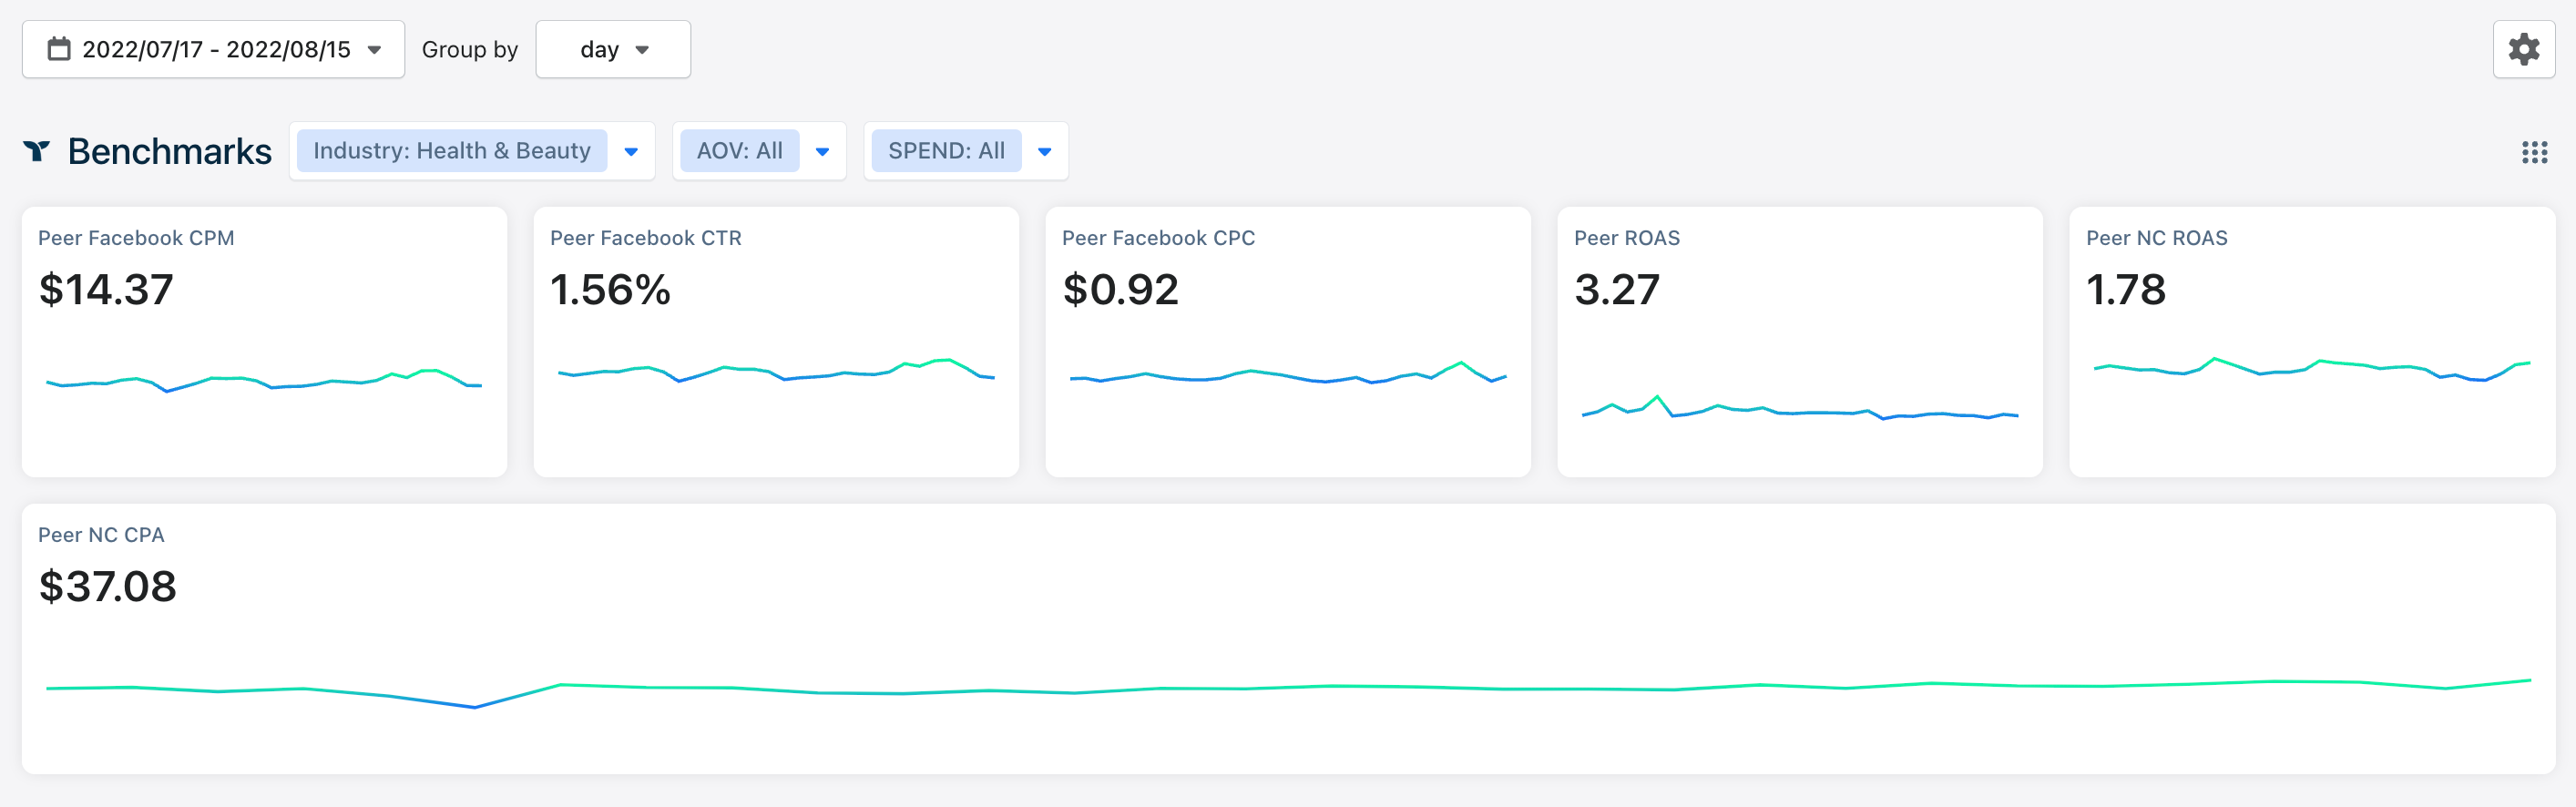
Click on the cog in the upper right hand corner of your summary page
Choose “Customize Summary”
Scroll down until you see “Benchmarks”
Click the “+” icon, then move the section to your desired location on your summary page
What filters are available for Triple Benchmarks?
Industry
- Art
- Baby
- Books
- Car & Truck Parts
- Cell Phones & Accessories
- Clothing
- Collectibles
- Computers
- Crafts
- Digital Products
- Electronics
- Fashion Accessories
- Food & Beverages
- Health & Beauty
- Home & Garden
- Jewelry & Watches
- Office Products
- Pet Supplies
- Shoes
- Sporting Goods
- Toys & Hobbies
Average Order Value (Average over the last 90 days (rolling))
- <$25
- $25-50
- $50-75
- $75-100
- $100-150
- $150
Blended Monthly Ad Spend (Average over the last 3 months (updated at the end of each month))
- <$10k
- $10-20k
- $20-50k
- $50-100k
- $100-250k
- $250k
What metrics are available in Triple Benchmarks?
- Facebook CPM $ (Cost per thousand impressions) = Total Amount Spent / Total Impressions x 1000
- Facebook CTR % (Click Thru Rate) = (Total link clicks / Total impressions) x 100
- Facebook CPC $(Cost per Link Click) = Facebook Ad Spend / Total link clicks
- Blended ROAS (# i.e. 5.5) = Sales / Blended Ad Spend
- NC-ROAS (new customer return on ad spend) (# i.e. 2.50) = New Customer revenue / Blended Ad Spend
- NCPA (New Customer Cost per Aqcuisition) ($ i.e. $30) = Blended Ad Spend / Count of New Customers
Track ROI for Every Influencer & Affiliate
With the Affluencer Hub you can track, manage and analyze all your affluencers (influencers & affiliates) across every platform using a combination of Discount Codes, the Triple Pixel and a Post Purchase Survey (Post Purchase Survey coming very soon).
The BEST news, it's completely FREE for existing Triple Pixel customers. If you're not an existing Triple Pixel customer, upgrade to the Triple Pixel in August and get the Affluencer Hub for free.
For a more detailed tutorial watch here:
Custom Expenses Has A New Look & Functionality
Expenses can now be categorized
- Define expense categories
- Expenses will be grouped by categories
- Clicking into the Custom Expensestile on theSummarypage will show a breakdown of how much was spent in each category within the selected date range (currently only accessible in the old summary page design)
Auditing your account is now easier than ever
- Any custom expenses that are created or edited will now show up in the activity feed
- Now see all of your expenses broken up by Cost Per Day
Monthly Recurral Cadences
- Previously recurral cadences could only be set up by number of days
- Recurral cadences can now be based on days or months
The Summary Page Has A New Look
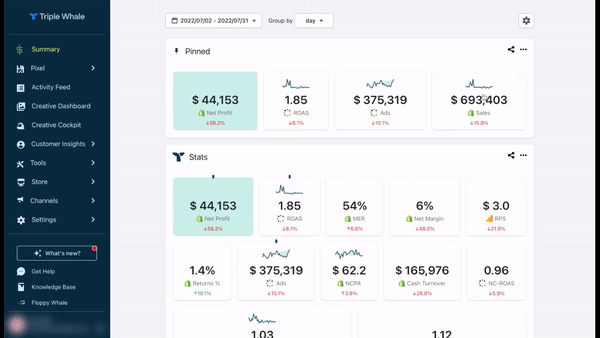
To get the new Summary Page design, click on the gear icon, and toggle on
New Design
. The new design allows users to toggle between line and bar graph views; users can hover over days within the line and bar graph views to get specific day values with in each section. Users will also notice a time period vs time period comparison automatically included within the visualization of each section.
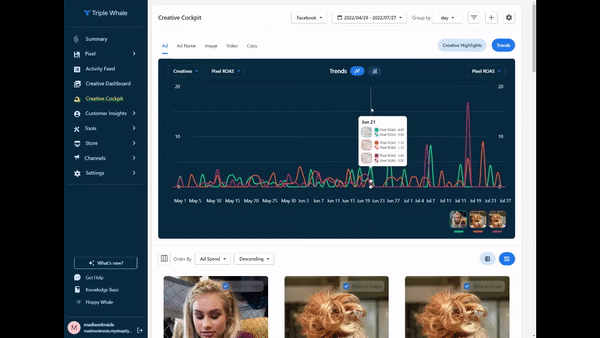
Is ad fatigue real? Does UGC, Video or Static content perform better overtime? Introducing Historical Facebook, TikTok and Pixel Data to satisfy all of your creative data needs! As always, our team continues to ship amazing new features weekly to help you grow smarter.
Historical Data has automatically been added to your Creative Cockpit. Just select an extended time period and the data will being to populate.
Learn How To Effectively Use The Creative Cockpit
In this video Saunder and Brandon, on the Product Marketing team, teach you how to best use Creative Cockpit as a Marketer to help your business scale smarter with your best ad creative.
Load More
→